This is your chance to make predictions for tomorrow – either on popular vote, seat totals, or on any of the close riding races you’ve been following that you think might surprise people. The final projections from the Calgary Grit simulation model are at the bottom of this post – but, before then, here’s what some other people are saying. I’ll be updating this post throughout the day tomorrow, so if you come across anything I’ve missed, feel free to send it my way.
First up, the polls:
Nanos
CPC 34.2%
Lib 26.7%
NDP 21.4%
Bloc 9.5%
Green 8.2%
Ipsos Reid
CPC 34%
Lib 29%
NDP 18%
Bloc 9%
Green 8%
Harris Decima
CPC 34%
Lib 25%
NDP 19%
Bloc 11%
Green 9%
Angus Reid
CPC 38%
Lib 28%
NDP 19%
Bloc 9%
Green 6%
Strategic Counsel
CPC 33%
Lib 28%
NDP 18%
Green 11%
Bloc 10%
Segma
CPC 34.6%
Lib 22.9%
NDP 20.5%
Bloc 10.3%
Green 10.2%
Ekos
CPC 34.8%
Lib 26.4%
NDP 19.4%
Green 9.6%
Bloc 9.8%
Then, the predictons and projections:
Election Prediction Project
CPC 125
Lib 94
NDP 36
Bloc 51
Ind 2
Democratic Space
CPC 128
Lib 92
NDP 34
Bloc 52
Ind 2
UBC Stock Market
CPC 131
Lib 89
NDP 39
BQ 47
Oth 2
Barry Kay Seat Projections
CPC 135
Lib 87
NDP 33
Bloc 51
Ind 2
David Akin
CPC 128
Lib 84
NDP 43
Bloc 50
Green 1
Ind 2
Andrew Coyne
CPC 133
Lib 88
NDP 34
Bloc 51
Ind 2
Ekos Predictions
CPC 136
Lib 84
NDP 35
Bloc 51
Ind 2
Scott Reid
CPC 124
Lib 82
NDP 43
Bloc 58
Ind 1
Kady O’Malley
CPC 129
Lib 91
NDP 33
Bloc 53
Ind 2
Andrew Steele
CPC 121
Lib 90
NDP 44
Bloc 50
Ind 3
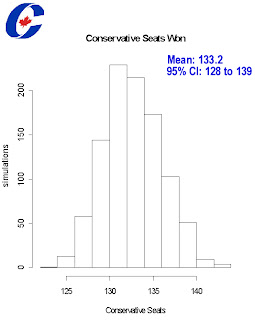
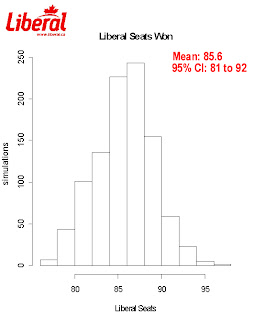
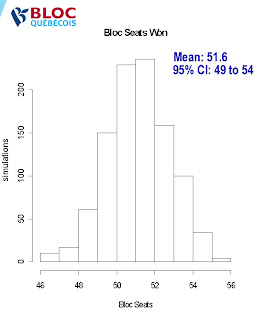
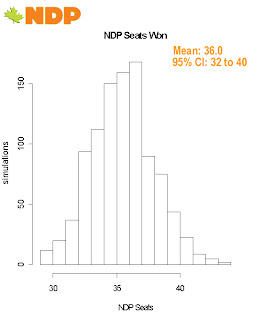
Which finally brings us to the Calgary Grit Simulation Projections. The methodology can be found here. The short version of it is that I’ve taken regional breaks on all publicly released opinion polls and plugged them into a model that takes into account results from the past 2 elections, by elections, and incumbency effects. Then, based on the variance of the polls and the variance in this model (found using ’04 data to project ’06), I simulate 1000 elections – this way, it recognizes that a projected 40% to 39% win in a riding only means the party on top has a better chance of winning the seat…they won’t neccesarily take it.
For this final update, I’d considered flushing all the data except for the last results from each pollster, but a lot of people do vote in advanced polls and thanksgiving polling is always kind of wonky so I’ve kept the model the same – that is, weighted using a 3 day half life (so 1000 interviews today is worth as much as 500 interviews 3 days ago). Because the final polls use bigger samples and are more recent, they’ll be weighted far more heavily anyways. Oh, and Strategic Counsel never posted the regional breaks from their final poll on their website, so they’ve been excluded.
So, with all that said, the model predicts:
CPC 133.2
Lib 86.2
Bloc 51.6
NDP 36.0
Ind 1.0
If you’re curious, just using the final polling numbers produces a very similar result of CPC 131.6, Lib 86.7, Bloc 52.5, NDP 36.2.
I spent some time this weekend going through things riding by riding and, as for my personal predictions, I’ll say: CPC 136, Lib 84, Bloc 49, NDP 37, Ind 2.
Below are the tables, regional breaks, confidence intervals, and all that jazz:


