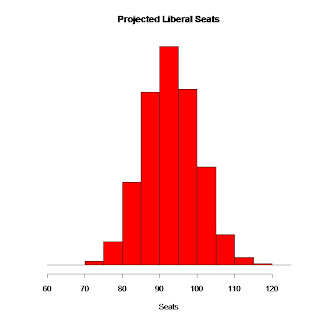
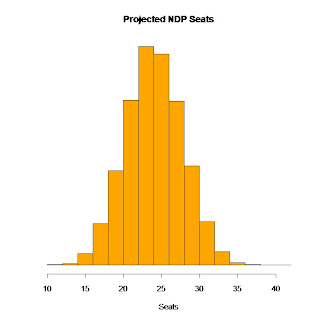
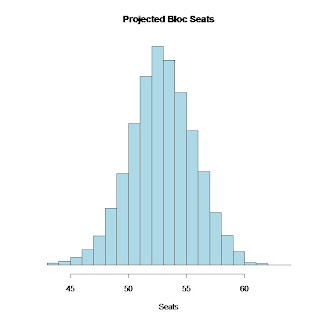
Below are my updated seat projections, I first posted in July. For the long methodology explanation, click here. To summarize it, the model projects the probability of each party winning every seat in the country, taking the following into account:
-Publicly released polling data
-2004, 2006, and 2008 election results
-Riding demographics
-The historical variance in riding results, compared to regional results
-Accuracy of Canadian pollsters in predicting recent provincial and federal elections
-Incumbency
-By election results
The benefit of this model over other projections is that this gives you a robust prediction that smooths out some of the blips you get when you only use the last election as your benchmark (like the Greens projected to win a seat in Atlantic Canada), it’s completely objective, and it takes “election day swings” when the polls are all off into account.
New this wave, I’ve assigned a two week “half life” to polls, which means a poll released this week is worth twice as much as a poll released a fortnight ago (assuming the sample size is the same and the “pollster accuracy” rating is the same).
It’s NOT a prediction of the next election, but reflects what we could expect if the election were held today.
So, with that, here are the updated projections:
On average, the Liberals are up 13.5 seats from July, with the Tories down 4.2, the NDP down 7.2, and the Bloc down 2.2. The largest gains for the Liberals have come in Ontario (up 9.4) and in BC (up 2.9). The Liberals “best case” scenario (upper end of 95% confidence interval) in Ontario has increased from 47 seats in July to 59 seats now.
The odds of a Tory majority have dropped from 1.6% down to 0.4%.


